PRICE SCALPER FOR NT8
Combine Price Action And Order Flow
Price action and order flow are two similar but different ways to trade the market.
Traders who trade with price action believe that anything that can affect the price is already reflected in it. While order flow traders how trade is being executed affects price.
It got me thinking...what if there was a way to combine price action with order flow? How could myself as a trader benefit from it?
The result was the Price Scalper which is a combination of price action and order flow.
The overriding goal of order flow analysis is that it allows you to figure out who is in control of the market. Once you know who is in control of the market it allows you to place trades with more confidence, monitor the trades you are in to close them early or stay in them longer, beyond your profit targets.
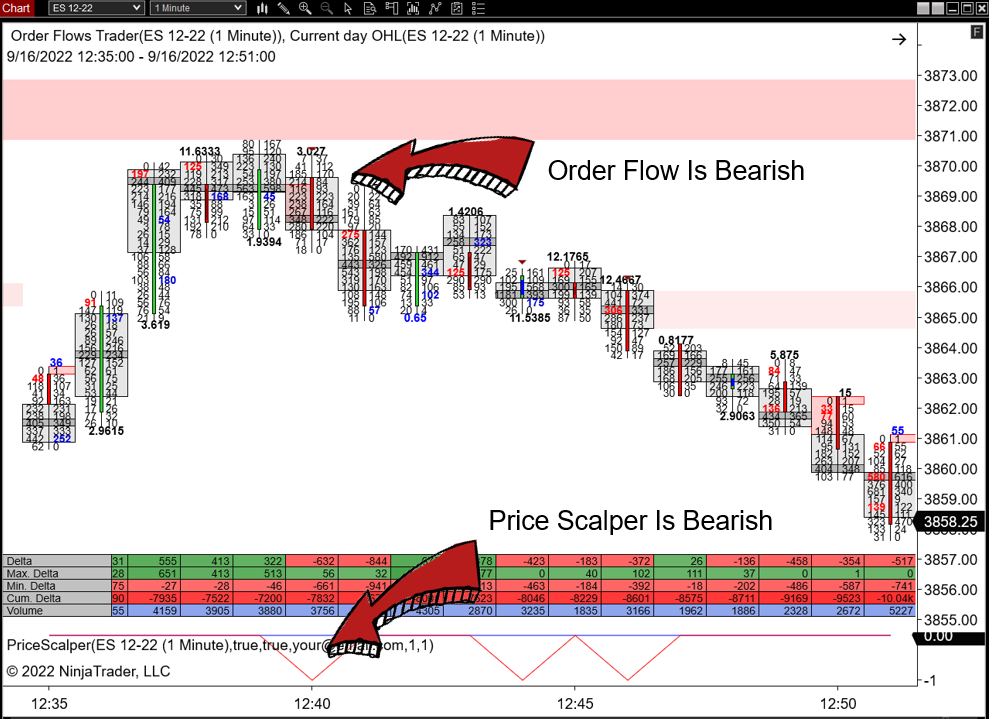
Price Scalper can be used alone, and it can also be used in conjunction with order flow.
Here is an example of having bearish sign in the Price Scalper which I am able to confirm with order flow.
Traders who trade with price action believe that anything that can affect the price is already reflected in it. While order flow traders how trade is being executed affects price.
It got me thinking...what if there was a way to combine price action with order flow? How could myself as a trader benefit from it?
The result was the Price Scalper which is a combination of price action and order flow.
The overriding goal of order flow analysis is that it allows you to figure out who is in control of the market. Once you know who is in control of the market it allows you to place trades with more confidence, monitor the trades you are in to close them early or stay in them longer, beyond your profit targets.
Price Scalper can be used alone, and it can also be used in conjunction with order flow.
Here is an example of having bearish sign in the Price Scalper which I am able to confirm with order flow.
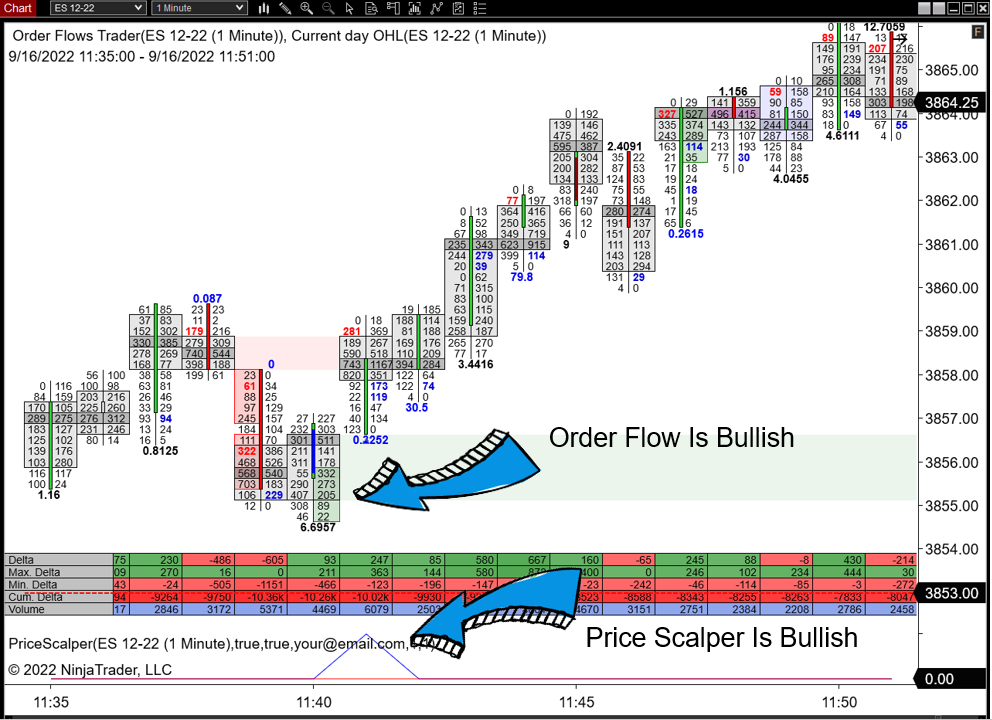
Here is an example of having a bullish sign in the Price Scalper what I am able to confirm with order flow.
As I said earlier, Price Scalper is a combination of price action and order flow. There are other ways to use it beyond using it with a footprint chart as confirmation. You can use it alone, just as a regular indicator. You can also use it in conjunction with other technical indicators.
Let's Take A Look At Some Charts
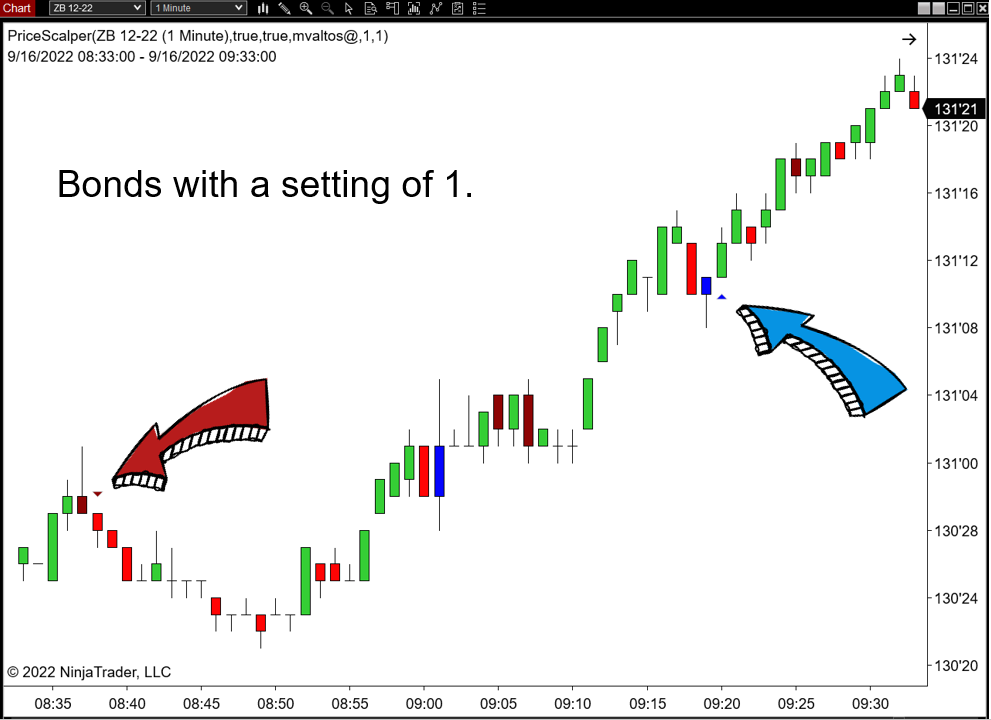
While Price Scalper was coded to run in conjunction with an order flow footprint chart, you will be happy to learn that Price Scalper will run on a normal candlestick chart.
When analyzing price action and order flow, a trader knows that each market has it own volatility, which as you know some markets move slow and trend nicely, while on the other extreme as markets that are highly volatile and trade more wild. While the price action is mostly the same, the order flow is going to be different.
Price Scalper allows a trader to compensate for that with the Swing Filter. You would use a low setting such as 1 (which is the lowest) for quiet markets and go up from there. I suggest settings of 1, 3, 5, 10, 25 and 50.
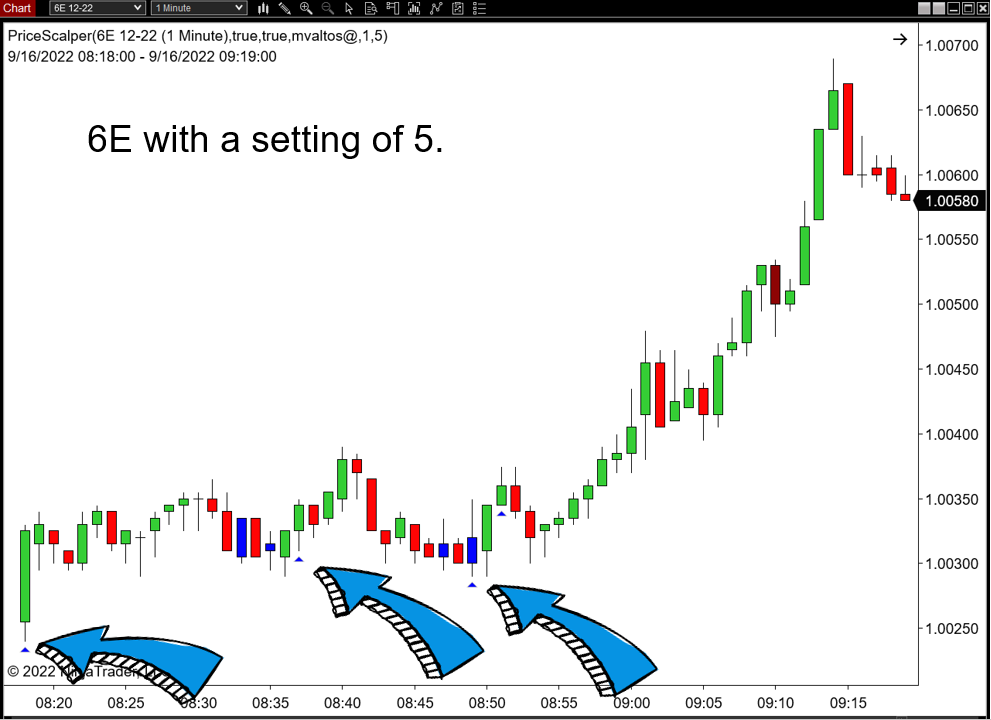
For slow moving markets like bonds, ZB, and ten years, ZN, I would suggest a setting of 1.
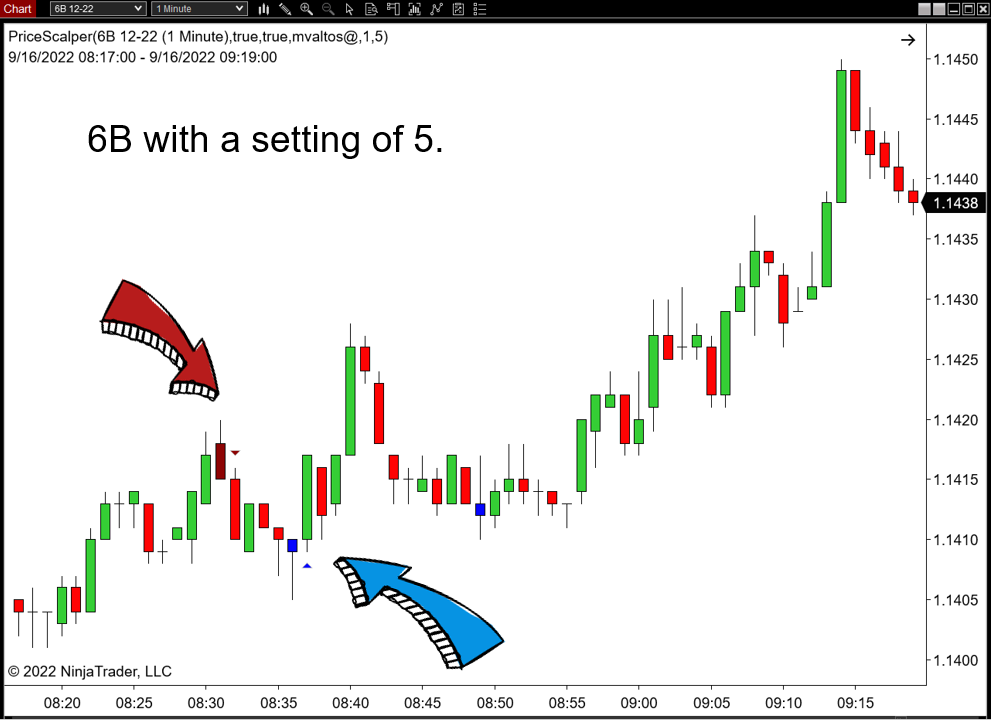
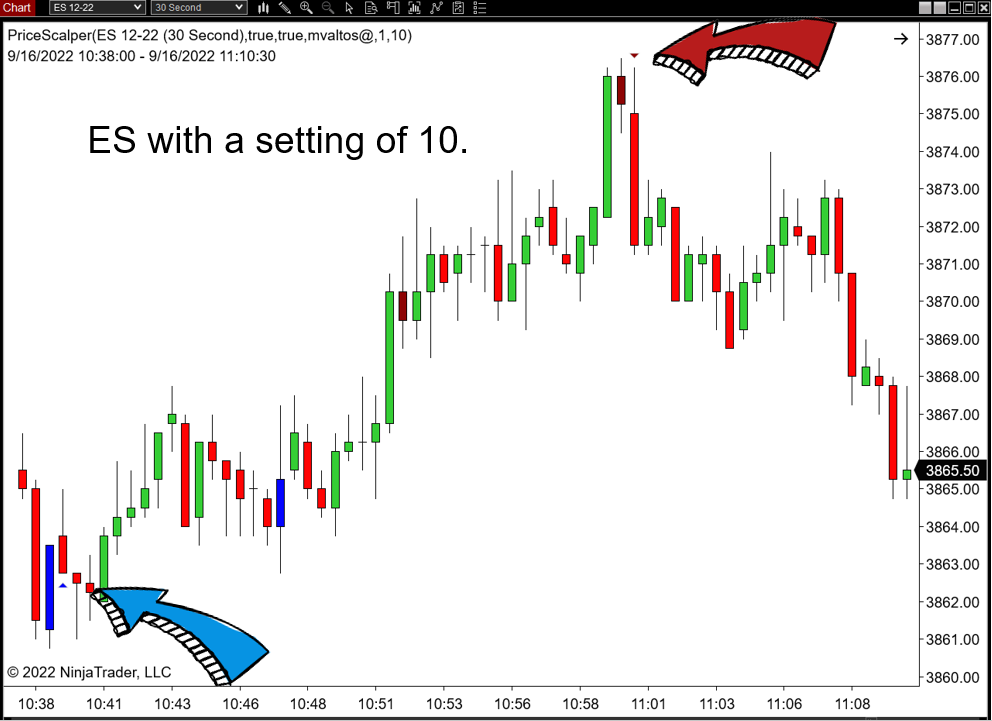
For normal moving markets like currencies and ES, I would suggest a setting of 5 or 10.
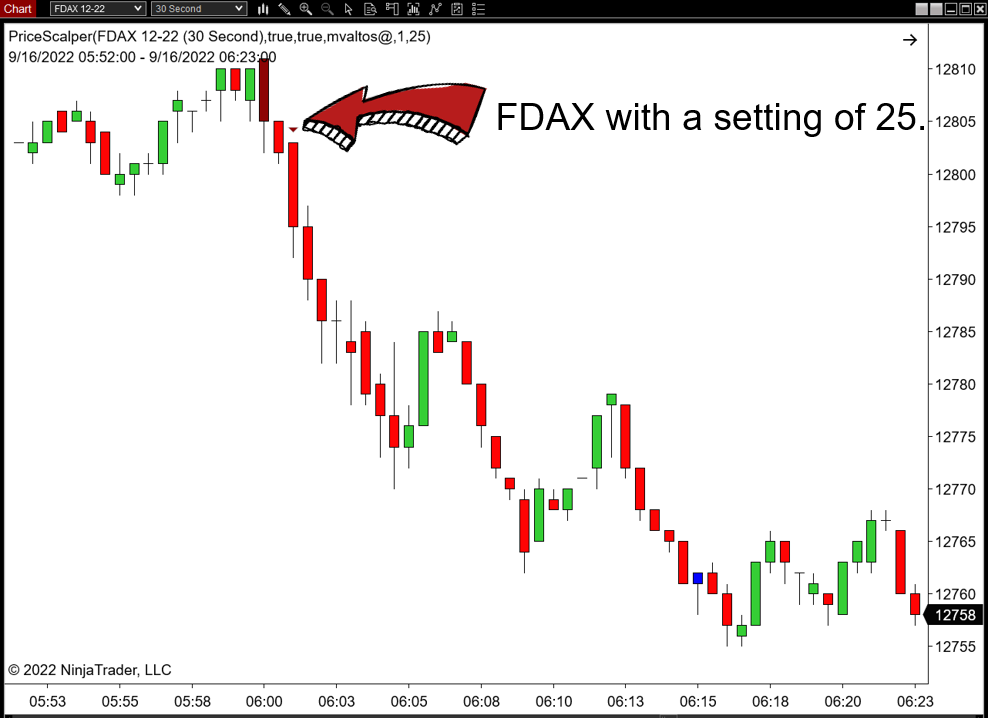
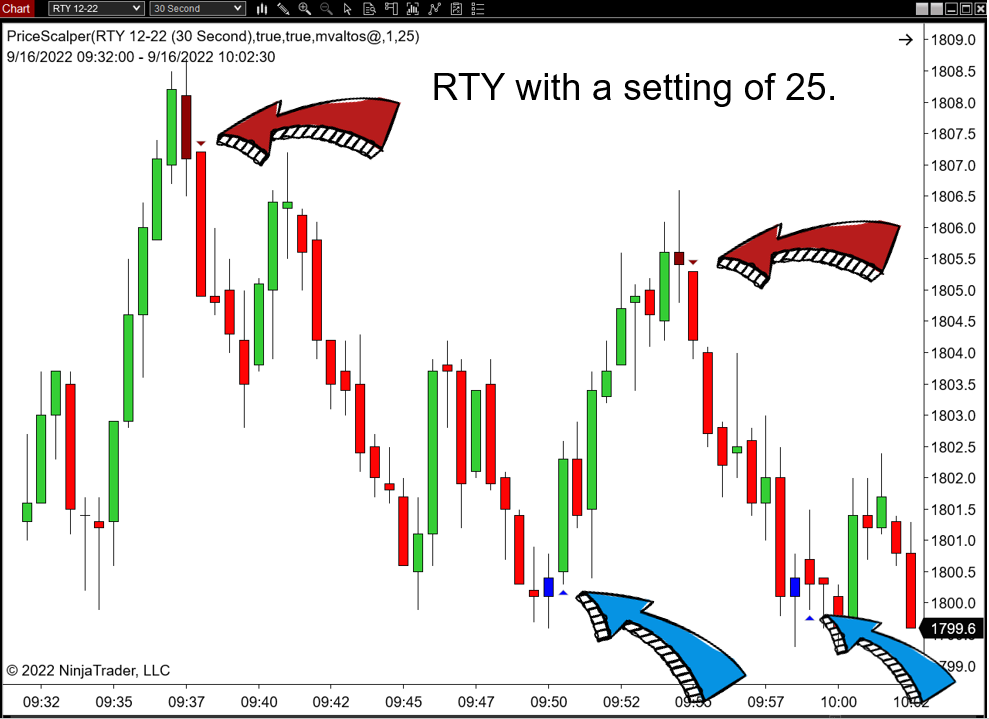
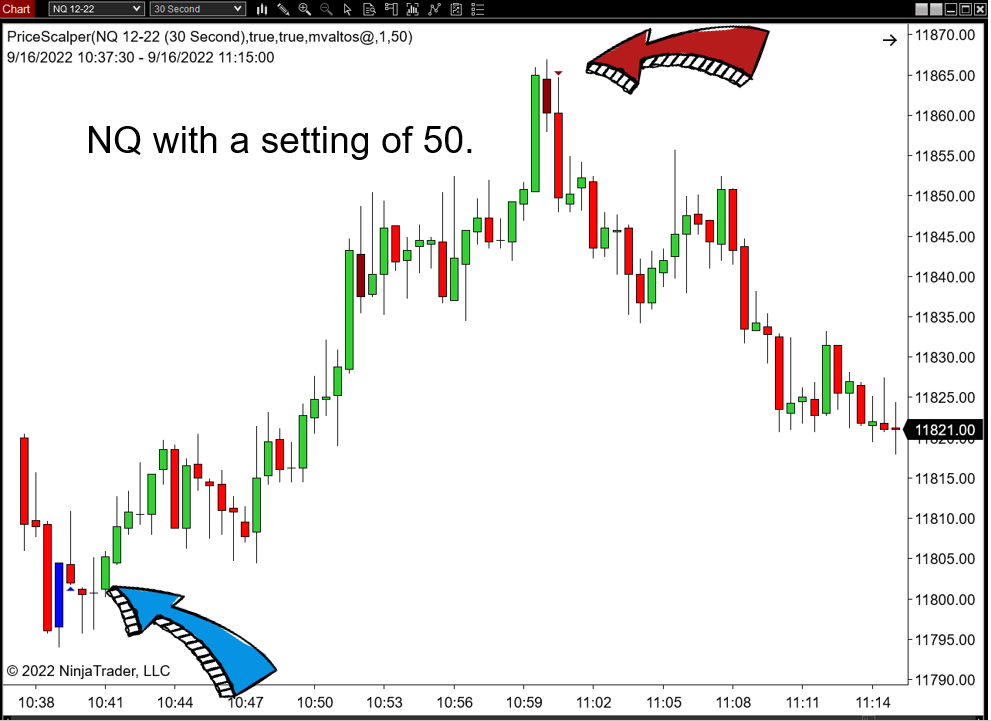
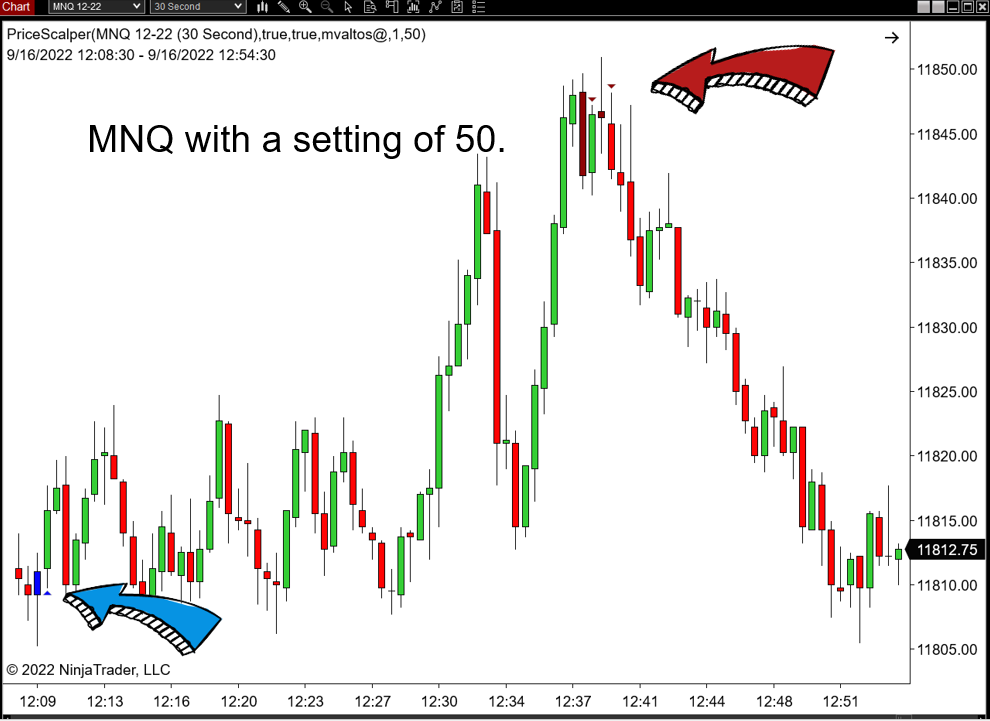
For the fastest, most volatile markets, like FDAX, YM, NQ, MNQ I would suggest a setting of 25 or 50.
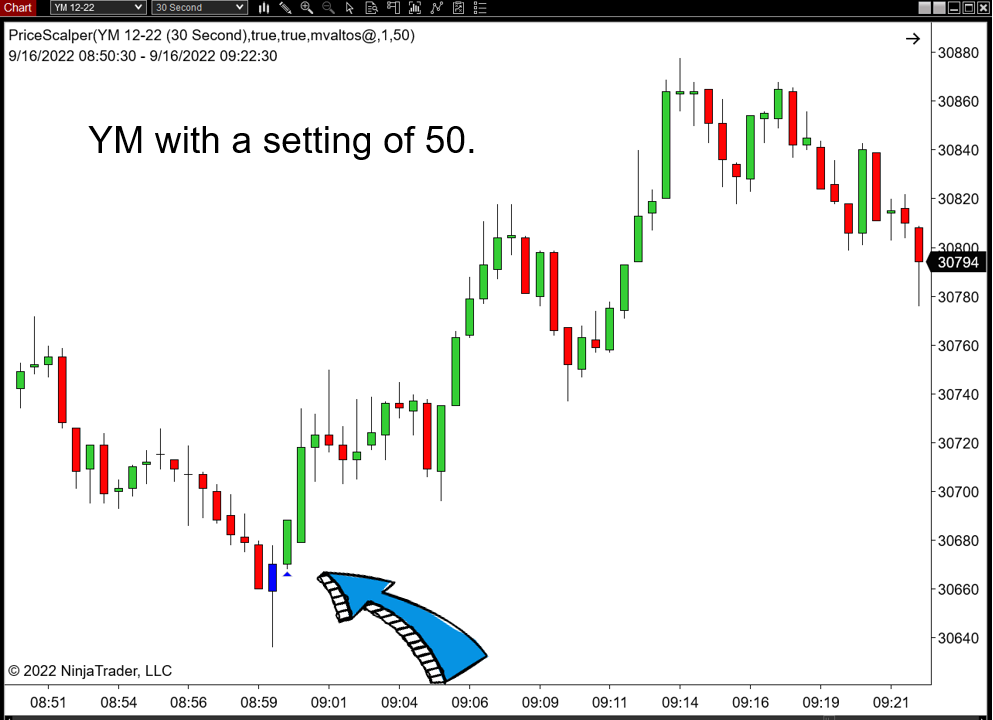
Ultimately, it is up to you to decide what setting you want to use for the market and chart type you trade. Some traders like to have a lot of trade signals, while others prefer less trades.
For most of my trading career, I have never been a fan or user of technical tools such as moving averages. I have always focused on order flow. But since starting Orderflows.com many users have been ways to combine order flow with technical indicators.
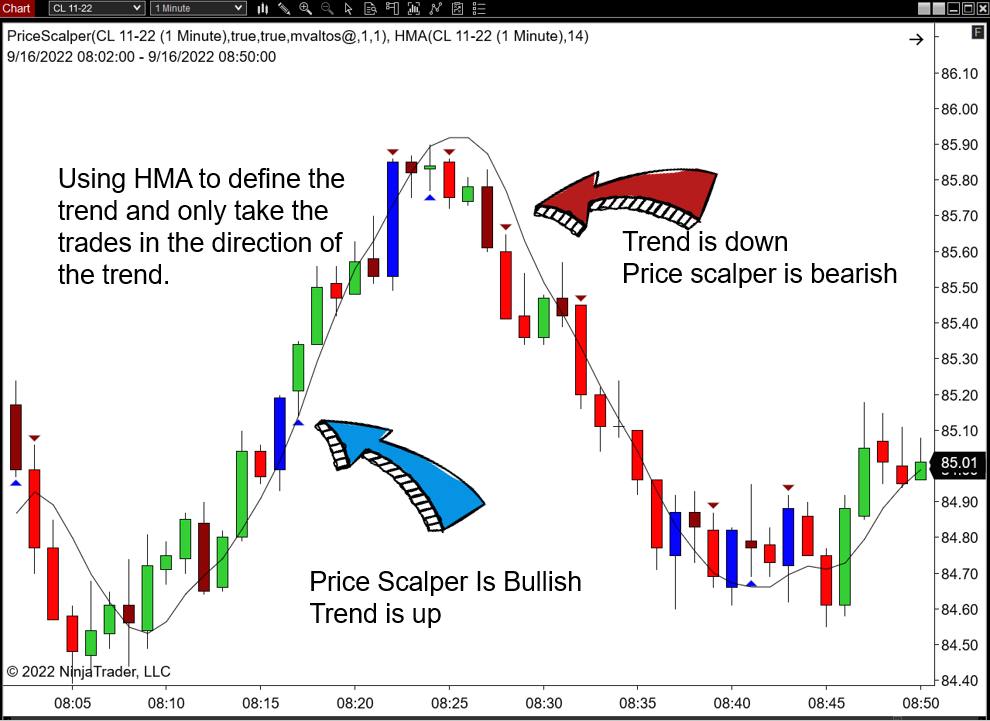
One of the ways that have been successful for many traders is trading order flow in direction of the trend and to do that is to use an HMA (Hull Moving Average). Other traders even used a 9 EMA.
One of the ways that have been successful for many traders is trading order flow in direction of the trend and to do that is to use an HMA (Hull Moving Average). Other traders even used a 9 EMA.
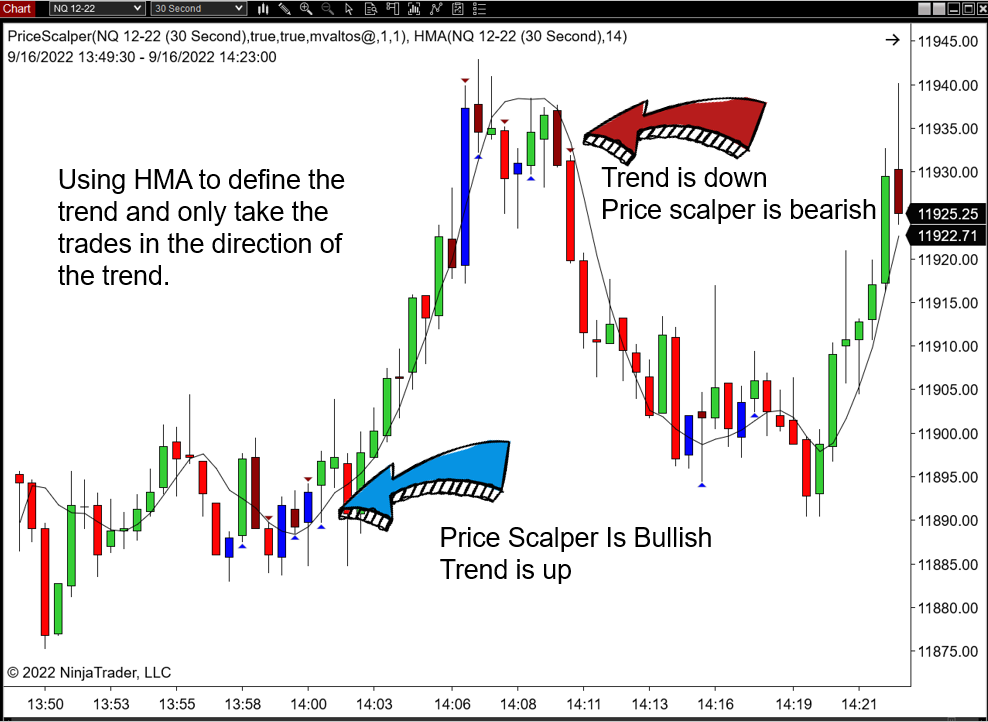
When using a trend filter, I suggest starting with the lowest setting of 1 to start because you are looking for the momentum (trend) in the market to trade with.
When creating Price Scalper, the thought of putting in a trend filter did arise. However, rather than restrict you we purposely left it out so you could create your own trading strategies with the Price Scalper as the foundation.
Get Price Scalper Now For Just A One-Time Payment Of $199
FAQs
Q. I have 2 PC's, do I need additional licenses?
A. No, your license is good for up to 5 PCs.
Q. Do I need to use tick replay?
A. No, tick replay is not required.
Q. Is the Price Scalper a footprint chart?
A. No. The Price Scalper is an order flow tools that analyzes all the data
you would normally see on a footprint chart - the delta, imbalances, POC and volume.
Q. Do I need a footprint chart to use the Price Scalper?
A. No, the Price Scalper will run on normal bar or candlestick chart as well as a footprint chart.
Q. What trading platform does the Price Scalper work on?
A. The Price Scalper is programmed for NinjaTrader 8.
Q. Do I need the PAID version of NinjaTrader 8 or can I use the FREE version?
A. The Price Scalper will run on the PAID version as well as the FREE version of NT8.
Q. I use Sierra Chart, is the Price Scalper available for Sierra Chart?
A. No. At the moment the Price Scalper is only available for NT8.
Q. I see you have different markets and different time frames, do I need to follow so many different markets?
A. No, I show you different markets and different chart types so you can see for yourself how the Price Scalper works under different conditions.
Q. Does the Price Scalper work with Markers Plus from The Indicator Store?
A. Yes it does.
Q. I trade Forex, can I use the Price Scalper to analyze FX markets?
A. Not really. Forex data is not centralized so analyzing order flow from various sources is not an ideal situation. If you want to trade Forex, I would suggest you trade the FX futures available at the CME where the data is centralized and better to analyze the order flow.
Q. What markets work best with Price Scalper?
A. Futures and stocks work best with the Price Scalper.
Q. What time frame is best for Price Scalper?
A. Order flow in generally is best for shorter time frames. If you trade anything from 30 second charts to 5 minutes, Price Scalper performs well. When you start analyzing order flow over 15 minutes, the order flow that happened earlier is not as relevant.
Q. Is there a sound alert?
A. Yes, there is a default sound alert that you can change to your own custom .wav file.
Copyright 2022 | pricescalper.com | All rights reserved
CFTC Rules 4.41:
Hypothetical Or Simulated Performance Results Have Certain Limitations, Unlike An Actual Performance Record, Simulated Results Do Not Represent Actual Trading. Also, Since The Trades Have Not Been Executed, The Results May Have Under-Or-Over Compensated For The Impact, If Any, Of Certain Market Factors, Such As Lack Of Liquidity. Simulated Trading Programs In General Are Also Subject To The Fact That They Are Designed With The Benefit Of Hindsight. No Representation Is Being Made That Any Account Will Or Is Likely To Achieve Profit Or Losses Similar To Those Shown.
Disclaimer:
This Presentation Is For Educational And Informational Purposes Only And Should Not Be Considered A Solicitation To Buy Or Sell A Futures Contract Or Make Any Other Type Of Investment Decision. Futures Trading Contains Substantial Risk And Is Not For Every Investor. An Investor Could Potentially Lose All Or More Than The Initial Investment. Risk Capital Is Money That Can Be Lost Without Jeopardizing Ones Financial Security Or Life Style. Only Risk Capital Should Be Used For Trading And Only Those With Sufficient Risk Capital Should Consider Trading. Past Performance Is Not Necessarily Indicative Of Future Results.
Risk Disclosure:
Futures And Forex Trading Contains Substantial Risk And Is Not For Every Investor. An Investor Could Potentially Lose All Or More Than The Initial Investment. Risk Capital Is Money That Can Be Lost Without Jeopardizing Ones’ Financial Security Or Life Style. Only Risk Capital Should Be Used For Trading And Only Those With Sufficient Risk Capital Should Consider Trading. Past Performance Is Not Necessarily Indicative Of Future Results.
Hypothetical Performance Disclosure:
Hypothetical Performance Results Have Many Inherent Limitations, Some Of Which Are Described Below. No Representation Is Being Made That Any Account Will Or Is Likely To Achieve Profits Or Losses Similar To Those Shown; In Fact, There Are Frequently Sharp Differences Between Hypothetical Performance Results And The Actual Results Subsequently Achieved By Any Particular Trading Program. One Of The Limitations Of Hypothetical Performance Results Is That They Are Generally Prepared With The Benefit Of Hindsight. In Addition, Hypothetical Trading Does Not Involve Financial Risk, And No Hypothetical Trading Record Can Completely Account For The Impact Of Financial Risk Of Actual Trading. For Example, The Ability To Withstand Losses Or To Adhere To A Particular Trading Program In Spite Of Trading Losses Are Material Points Which Can Also Adversely Affect Actual Trading Results. There Are Numerous Other Factors Related To The Markets In General Or To The Implementation Of Any Specific Trading Program Which Cannot Be Fully Accounted For In The Preparation Of Hypothetical Performance Results And All Which Can Adversely Affect Trading Results.
Thanks for subscribing. Share your unique referral link to get points to win prizes..
Loading..
